
SEMI: New paradigm set for capacity and equipment spending
The rock band Supertramp titled its fourth album "Crisis? What Crisis?" The title of the album, released in 1975, reflected the economic situation during that time.
So say Christian Gregor Dieseldorff and Dan Tracy at the SEMI Industry Research & Statistics Group .
Back in 1973, OPEC proclaimed an oil embargo causing oil prices to soar; the stock market crashed and idled from January 1973 to December 1974, with the Dow Jones losing over 45 percent in 699 days; and a global recession put an end to the general post-World War II economic boom.
This recession lasted from 1973 to March 1977, although the effects on the U.S. were felt into Ronald Reagan's first term. At that time, the semiconductor industry was in its infancy.
Worldwide, the semiconductor industry growth rate back in 1973 was about 30 percent and slipped into 1975 with negative sales growth rates. Following a recovery in the late 1970s into the 1980s, the next negative growth for the semiconductor industry occurred in 1985 with a 17 percent decline in revenue.
Another year of decline includes the 8 percent slide in 1998, surrounded by the Asian financial crisis in 1997 and the Russian financial crisis in 1998. The largest drop for the semiconductor industry, however, occurred in 2001 with the burst of the dot-com bubble, causing revenues to fall by a massive 32 percent.
More recently, the housing bubble crisis and the European sovereign debt crisis resulted in a revenue decline of 9 percent in 2009, certainly not as severe as in 2001 though the industry was on edge for a number of quarters as uncertainty reigned throughout the global economy.
Comparing the 2001 crisis to the most recent crisis suggests a paradigm change for the semiconductor industry has transpired. Before 2009, capacity additions corresponded closely to fab equipment spending.
These days, much more money is spent on upgrading existing facilities, while new capacity additions are much lower. In fact, the pace of new capacity additions has dropped to levels previously seen only during an economic crisis.
2013 Installed Capacity Growth Mimics Economic Crisis Behaviour
When SEMI's May fab database report was released, fab capacity was expected to increase 2.4 percent in 2013. By August, this was taken down.
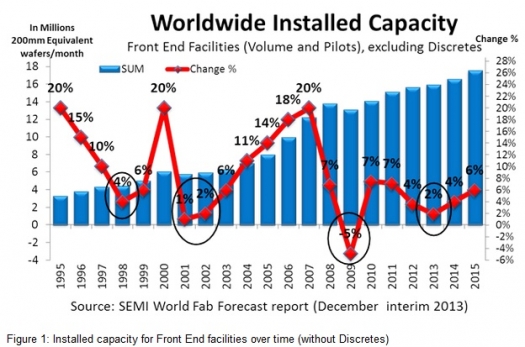
New data have caused a further revision down to 1.9 percent for 2013 (see Figure 1). The SEMI World Fab Forecast Report data also support lower expectations for capacity expansion in 2014 (5.4 percent predicted in May, down to 3.9 percent in August, and now to 3.3 percent in November). Most likely, device makers seek to avoid oversupply and a drop in selling prices for devices.
The figure shown at the top of this story shows the installed capacity for Front End facilities over time (without Discretes).
Looking at the trends in the last eighteen years, capacity growth rate in 2013 is at levels seen during an economic crisis, but what crisis exists?
Semiconductor revenues for 2013 are expected to grow 4 to 6 percent, and 2014 expectations are also positive, mirroring other upward looking market indicators such as auto sales (at a six year high in September 2013), the Dow Jones (at a record high of 16,000 points in December 2013), and expansion of the U.S. GDP (up 4.1 percent in the 3rd quarter, as of mid-December 2013). So, why the low rate in capacity expansions?
The last time installed capacity growth rate was under 2 percent was during the 2009 economic crisis, and before that, in 2001. Even when impacted by the 1997 Asian Financial Crisis and the 1998 Russian Financial Crisis, capacity growth rates did not fall below 4 percent.
So in examining history, capacity expansion in 2013 has behaved as if there were an economic crisis, despite no new crisis. In addition, SEMI (Figure 1) shows that addition of new capacity in 2014 will rank this year at the 4th lowest level over the past 18 years.
Another Paradigm: More Fab Equipment Spending for Existing Facilities
Examining historic trends for equipment spending, most fab equipment spending before the 2009 crisis was going towards adding new capacity. After 2009, while fab equipment spending recovered, new capacity additions trended below pre-2009 growth rates (see the figure below).

Fab equipment spending (new and used) for Front End facilities vs change rate of installed capacity
In the five years between 2003 and 2007, the growth rate of new capacity increased from 6 percent in 2003 to 20 percent growth in 2007 (almost doubling the fab capacity in 5 years), according to the SEMI World Fab Forecast Report. This was driven mainly by DRAM and NAND companies in Korea, Taiwan and China.
After the 2009 economic crisis, however, growth of new capacity dropped from 7 percent in 2010 to about 4 percent in 2014, thus with the expected capacity addition of only 17 percent in the five years from 2009 to 2014. Especially after 2009 we observed a number of company consolidations (Elpida, Powerchip, Rexchip), restructuring or change of direction (Promos, SMIC and a number of Japanese device makers), and even bankruptcy (Qimonda).
Increasing Spending for Upgrade Projects
Since the 2009 crisis, expenditures on upgrading existing equipment have grown sharply. Expansion projects, such as new fabs still account for the majority of fab equipment spending, but in lower proportions than in the past, as shown in the graph below.

Fab Equipment Spending for new and used equipment (Front End) for expansion projects and upgrade projects
Costs for adding new equipment to a new facility are typically higher than upgrading some of the existing equipment. The number of companies building and equipping fabs continues to shrink through consolidation into larger companies as leading-edge technology upgrades become more expensive.
Deployment of some leading-edge technology has begun to slow as NAND and DRAM industry bit growth moderates. For example, the cost per wafer to upgrade NAND to 3D generation may be twice as much as it was for 20nm class upgrades.
The New Paradigm
According to SEMI, the two industry segments predicted to add the most capacity, based on demand, are foundries and NAND in 2013 and 2014. Dedicated foundries grew at a steady 10 percent in 2013, and will add another 8 to 10 percent in 2014.
For the second largest segment, NAND, which lost about 4 percent of capacity in 2012, capacity rose 10 percent in 2013 and will add another 5 to 8 percent in 2014. Other segments, such as DRAM, Analogue, and Logic, are not expected to add new capacity in 2013 and 2014. MPU may add some new capacity by 2014.
Top makers of mobile phones, Samsung and Apple, are major drivers for the industry. For example, after six years, Apple finally unlocked a crucial deal for iPhone sales in China with 760 million potential customers, twice the U.S. market. This will inspire greater capacity additions such as for foundries and NAND.
Even in 2014, when the top two segments, foundry and NAND, are adding new capacity in upper single digits, the overall fab capacity growth rate globally is still among the five lowest in 18 year history meaning that other segments add little or no new capacity, or focus on upgrading process technology.
Crisis? What Crisis? The year 2013 was an unusual year. Compared to historical trends, globally new capacity growth appeared as in a year of economic crisis but there was none, and 2014 will be yet another year of minimal fab capacity expansion overall for the industry. Sectors that serve the leading edge for mobile devices will add the most capacity; other sectors reflect the lower growth observed across the broader semiconductor industry since the 2010 recovery.
Activity Report
The SEMI World Fab Forecast lists about 1,150 facilities. Sixty-seven of these (with various probabilities) have started or will start volume production in 2013 or later. The report lists major investments (construction projects and equipping) in 206 facilities and lines in 2013, and 180 facilities and lines in 2014.
Since the last fab database publication at the end August 2013, SEMI's worldwide dedicated analysis team has made 301 updates to 257 facilities (including Opto/LED fabs) in the database. The latest edition of the World Fab Forecast lists 1,149 facilities (including 250 Opto/LED facilities), with 67 facilities with various probabilities starting production this year and in the near future. SEMI added seven new facilities and closed eleven facilities.


